Condition of local roads
Road condition assessments on the local classified road network in England are currently made predominantly using Surface Condition Assessment for the National Network of Roads (SCANNER) laser-based technology.
A number of parameters measured in these surveys are used to produce a road condition indicator which is categorised into three condition categories:
- Green - No further investigation or treatment required
- Amber - Maintenance may be required soon
- Red - Should be considered for maintenance
From 2026/27 a new methodology will be used based on the BSI PAS2161 standard. Local Highway Authorities will be required to use a supplier that has been accredited against PAS2161. This new standard will categorise roads into five categories instead of three to help government gain a more detailed understanding of road conditions in England.
GOV.UK - Road condition statistics: data tables (RDC)
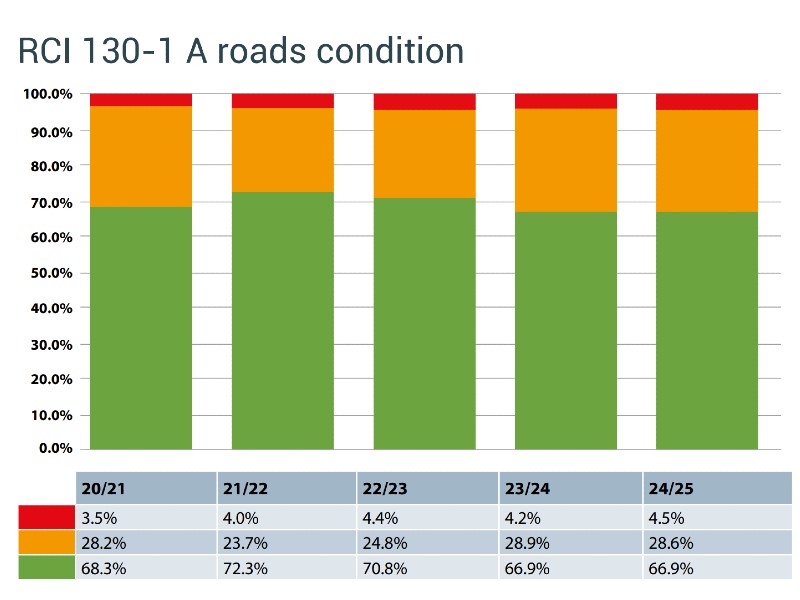
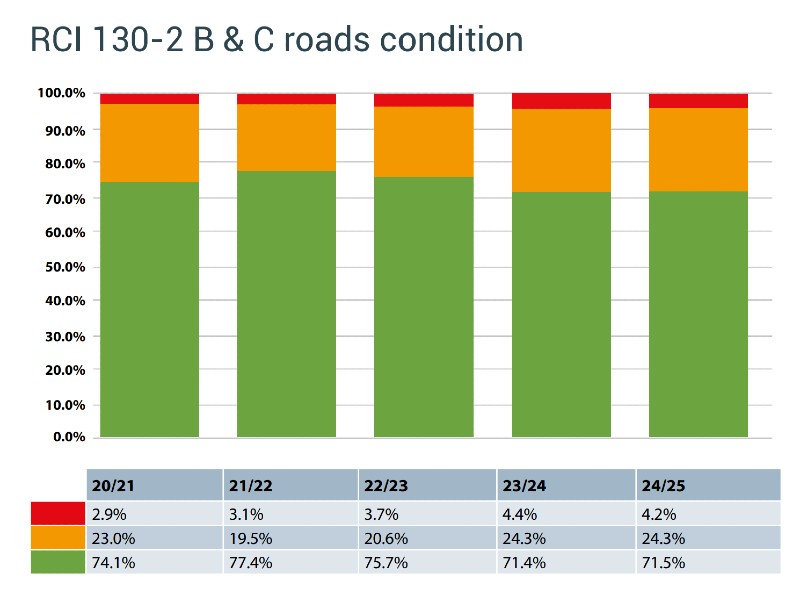
Data on A, B and C roads is collected annually by surveying one direction, this is alternated so that we collect both lanes over a two year period.
| Year | Red | Amber | Green |
|---|---|---|---|
| 2020 | 3.5% | 28.2% | 68.3% |
| 2021 | 4% | 23.7% | 72.3% |
| 2022 | 4.4% | 24.8% | 70.8% |
| 2023 | 4.2% | 28.9% | 66.9% |
| 2024 | 4.5% | 28.6% | 66.9% |
| Year | Red | Amber | Green |
|---|---|---|---|
| 2020 | 2.9% | 23% | 74.1% |
| 2021 | 3.1% | 19.5% | 77.4% |
| 2022 | 3.7% | 20.6% | 75.7% |
| 2023 | 4.4% | 24.3% | 71.4% |
| 2024 | 4.2% | 24.3% | 71.5% |
| Year | Percentage of U roads in the red category |
|---|---|
| 2020 | 17% |
| 2021 | 17% |
| 2022 | 11% |
| 2023 | 13% |
| 2024 | 13% |
Data on unclassified road network has been historically collected using a Coase Visual Inspection (CVI). The data was collected over two years for the whole network. This duplicated some of the data collected on the classified road network by the SCANNER survey.
For 2025/26, we are changing condition assessment method to be in line with the survey methodology for the classified network. This will give us better data and means we can report carriageway performance in the same way across all road classifications. The survey will take three years to complete a full network assessment; however, the higher used roads will be completed in two years in line with the classified network.
| Year | Very good | Good | Fair | Poor | Very poor |
|---|---|---|---|---|---|
| 2020/21 | 29.6% | 39.9% | 24.6% | 5.5% | 0.4% |
| 2021/22 | 32.1% | 38.7% | 25.2% | 3.9% | 0.2% |
| 2022/23 | 32% | 39.8% | 24.5% | 3.6% | 0.1% |
| 2023/24 | 30.3% | 42.7% | 23.2% | 3.7% | 0.1% |
| 2024/25 | 27.1% | 42.7% | 26.5% | 3.6% | 0.2% |