County highways performance dashboard
Annual road condition scores
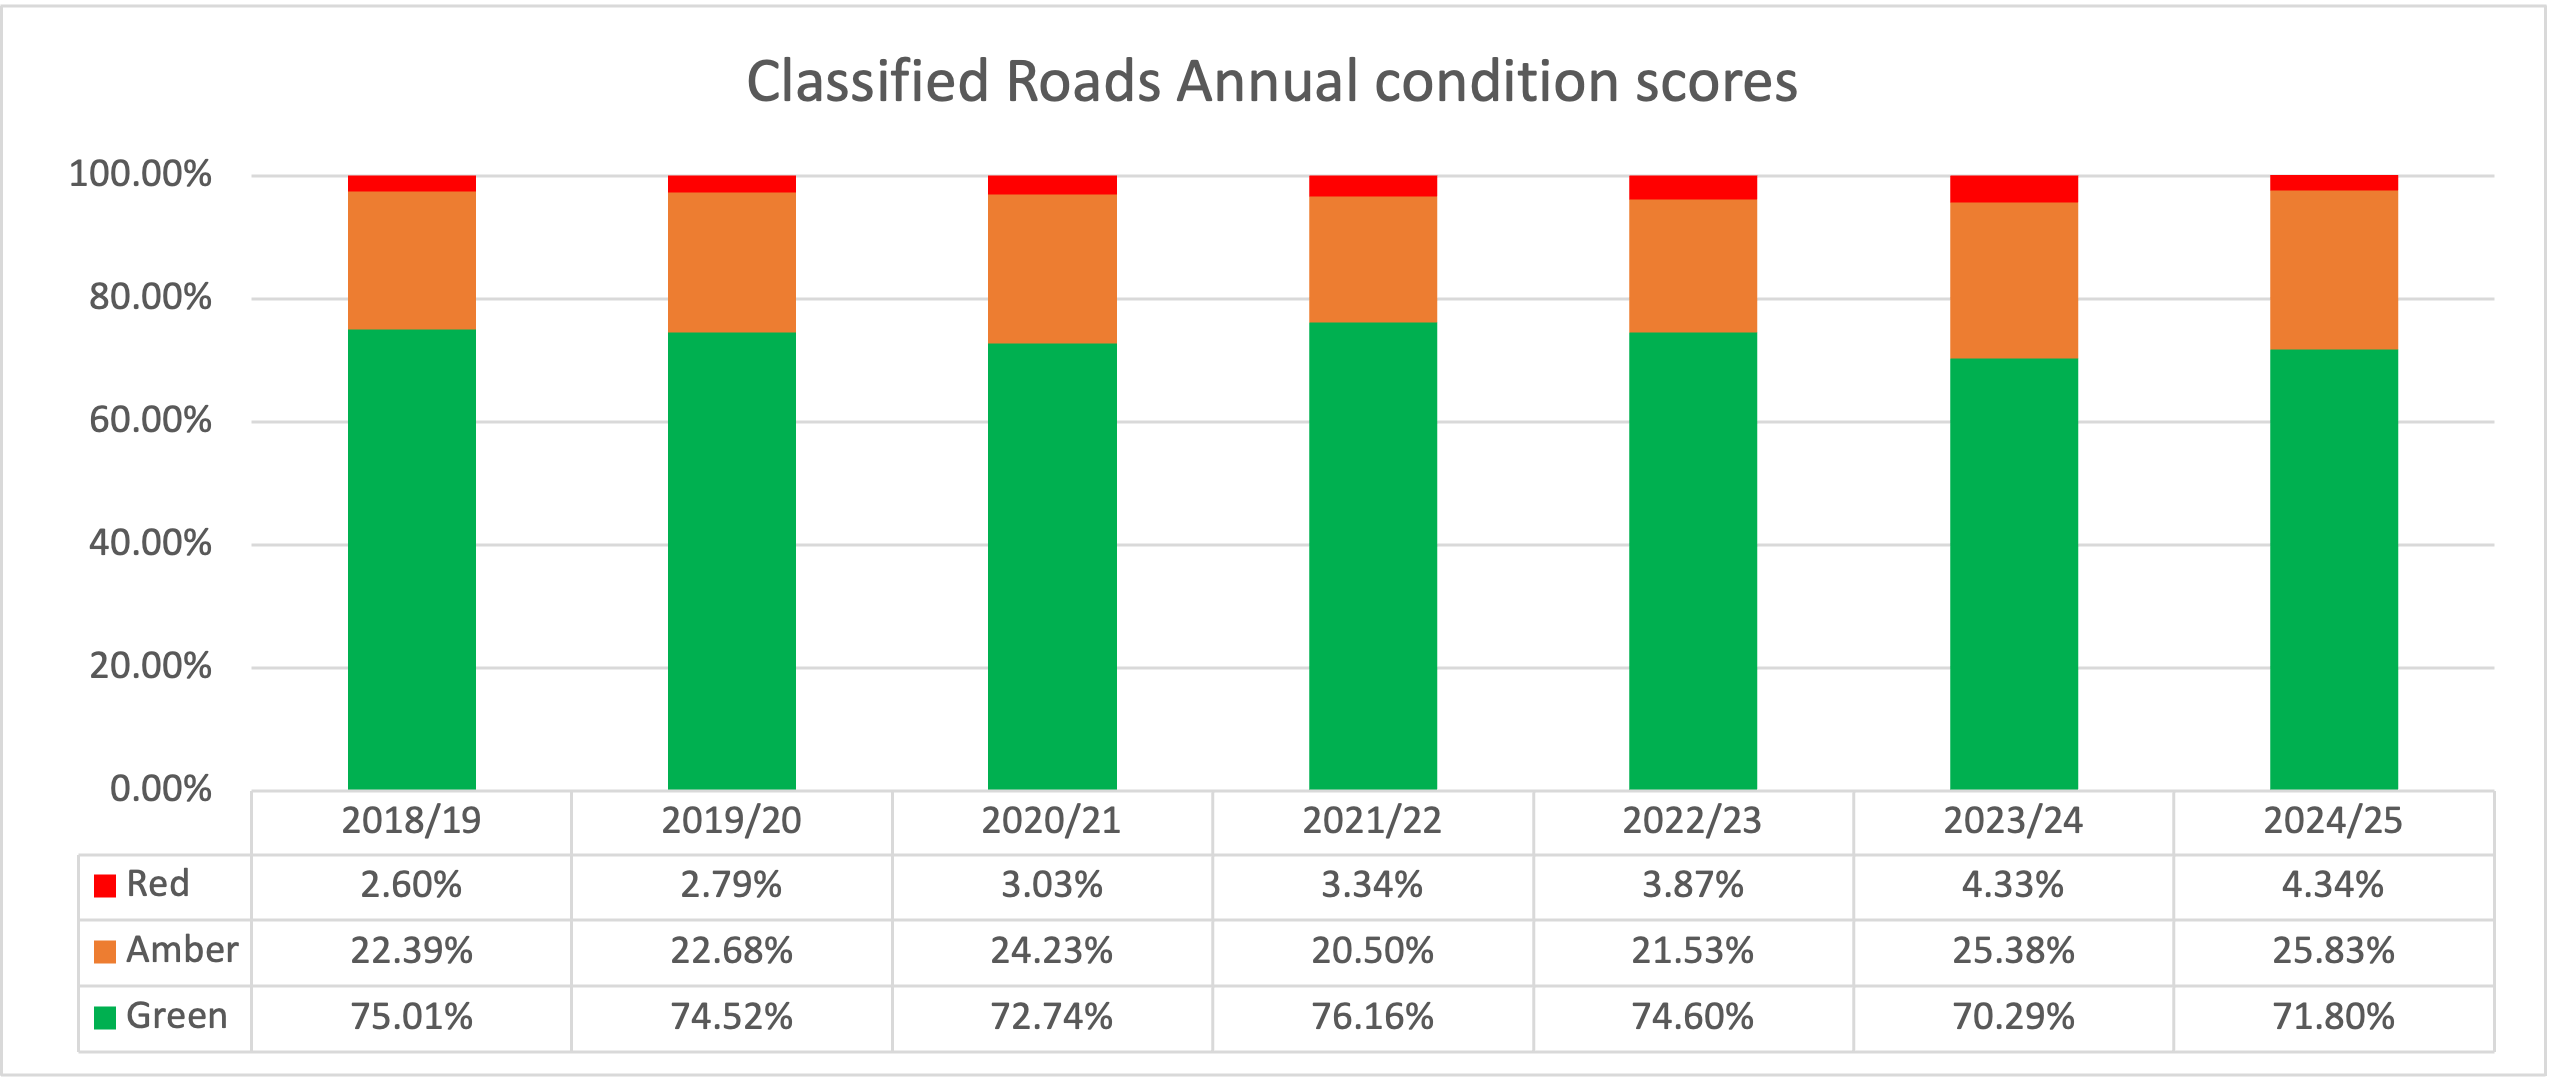
We undertake annual condition surveys of our classified road network (A, B and C Roads) which produce condition scores for our network. These scores are reported back to central government – more information can be found on GOV.UK.
We utilise these condition scores to help identify sections of our network requiring works. The graph shows our classified network condition scores:
- Red – Plan maintenance soon
- Amber – Plan investigation soon
- Green – Generally good condition
| 2018/19 | 2019/20 | 2020/21 | 2021/22 | 2022/23 | 2023/24 | 2024/25 | |
|---|---|---|---|---|---|---|---|
| Green | 75.01% | 74.52% | 72.74% | 76.16% | 74.6% | 70.29% | 71.80% |
| Amber | 22.39% | 22.68% | 24.23% | 20.5% | 21.53% | 25.38% | 25.83% |
| Red | 2.6% | 2.79% | 3.03% | 3.34% | 3.87% | 4.33% | 4.34% |
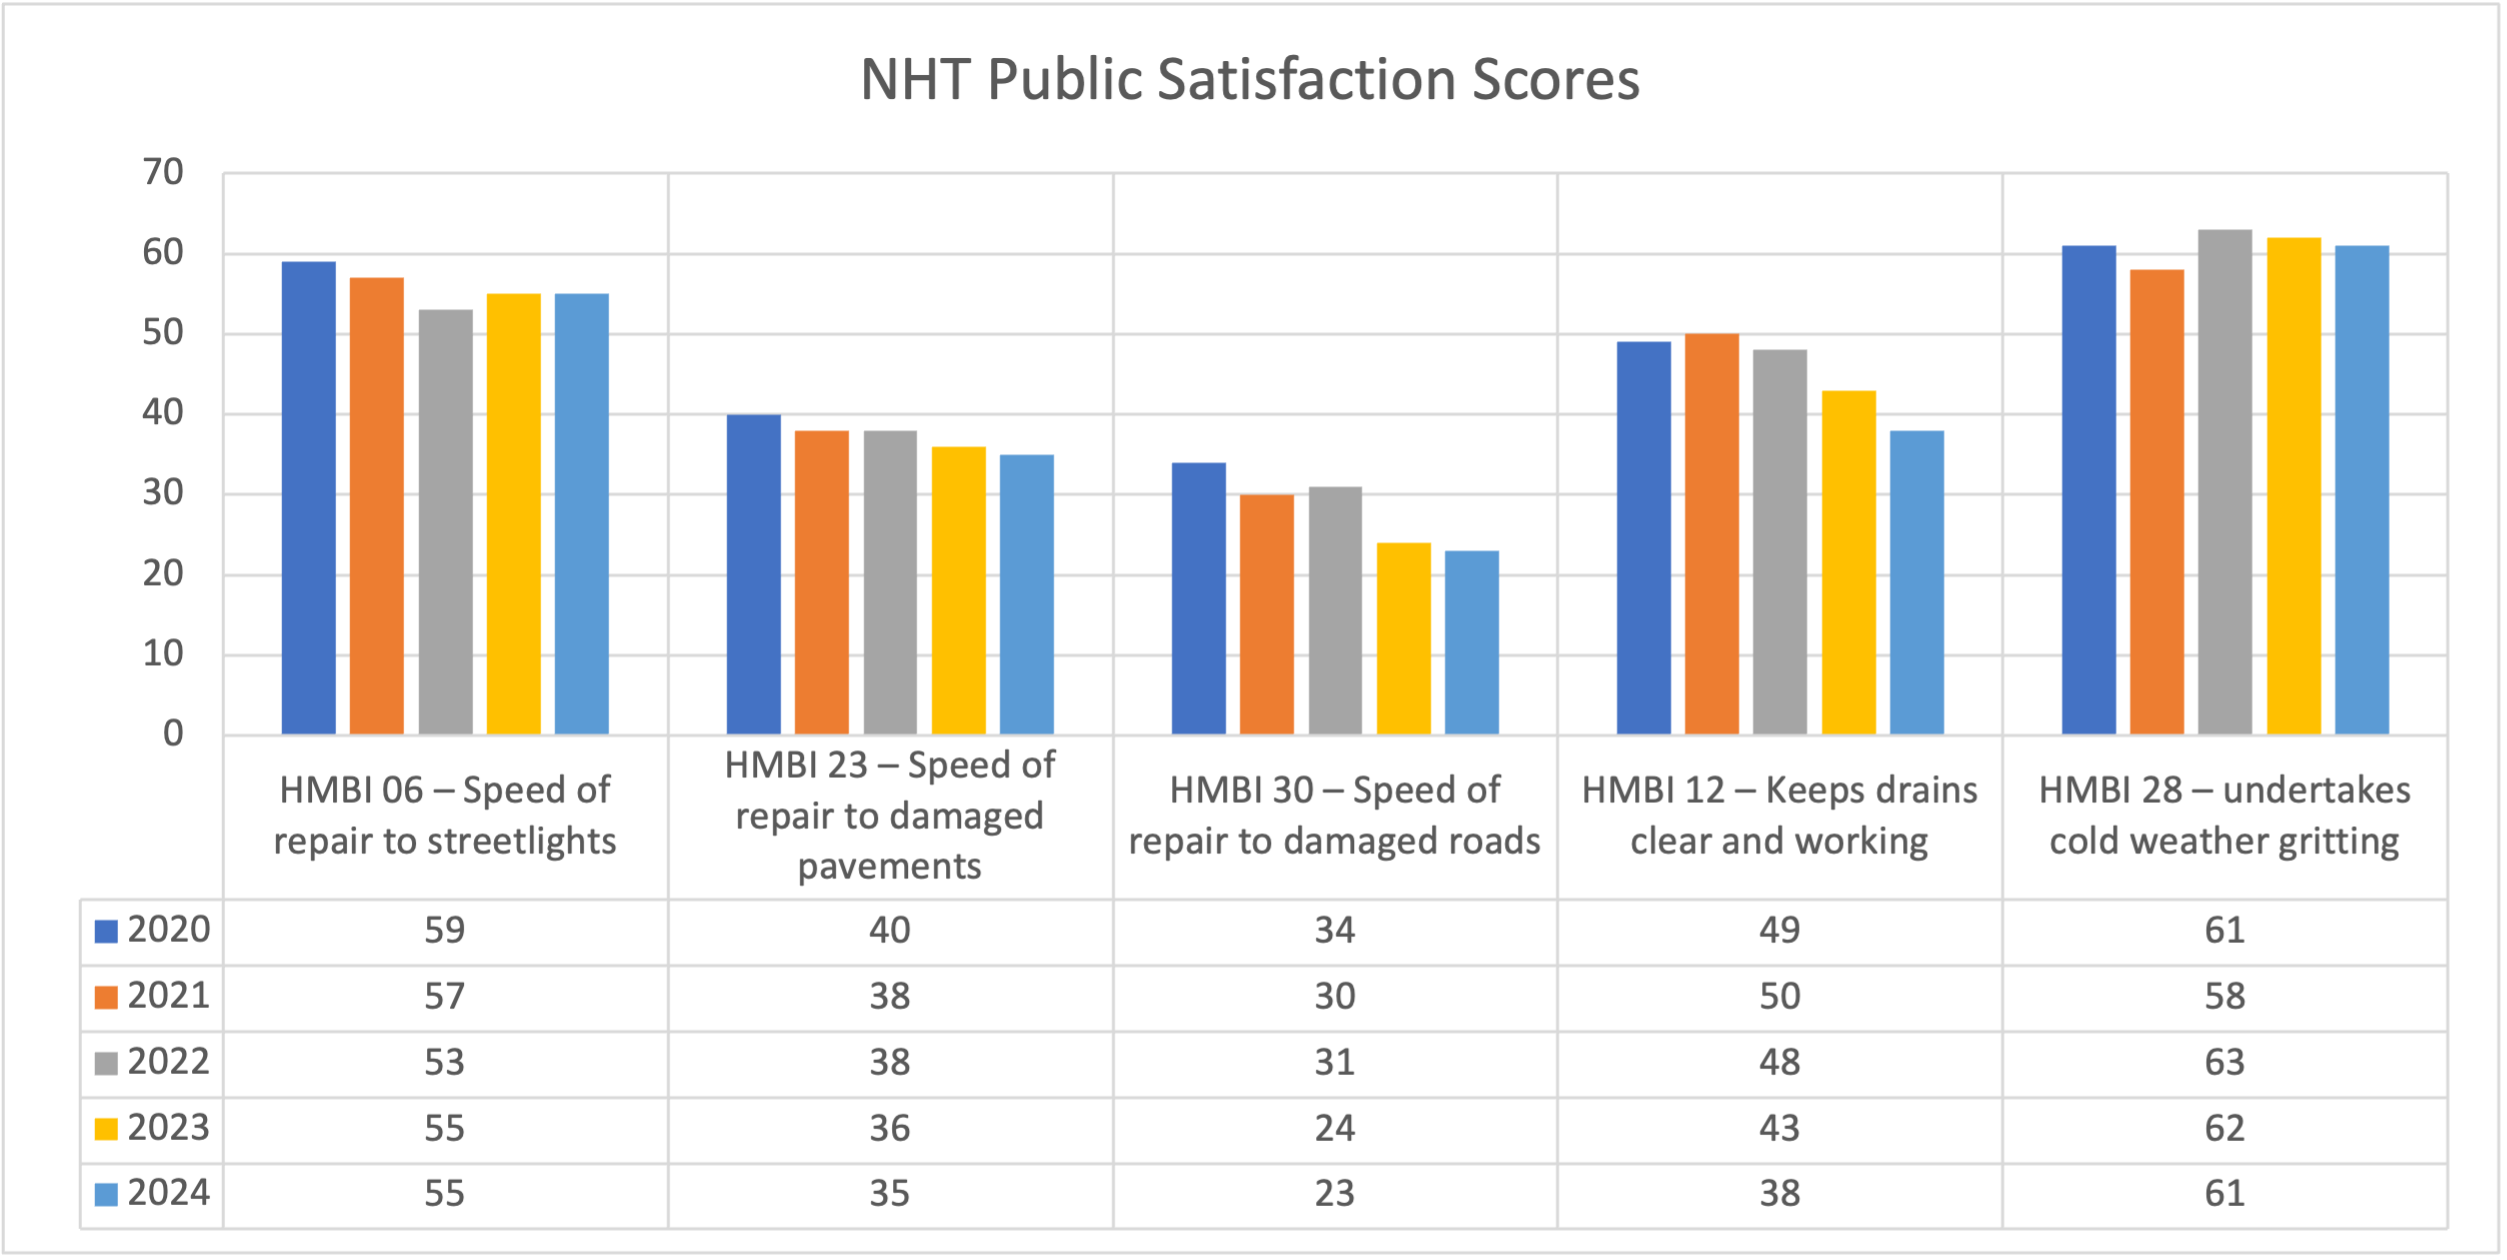
Annual public satisfaction survey results
Key Highways maintenance related results from the annual independent NHT survey.
| NHT Public Satisfaction | 2020 | 2021 | 2022 | 2023 | 2024 |
|---|---|---|---|---|---|
| HMBI 06 - Speed of repair to street lights | 59 | 57 | 53 | 55 | 55 |
| HMBI 07 - Speed of repair to damaged roads/pavements | 40 | 38 | 38 | 36 | 35 |
| HMBI 08 - Quality of repair to damaged roads/pavements | 34 | 30 | 31 | 24 | 23 |
| HMBI 12 - Keeping drains clear and working | 49 | 50 | 48 | 43 | 38 |
| HMBI 17 - Undertakes cold weather gritting | 61 | 58 | 63 | 62 | 61 |
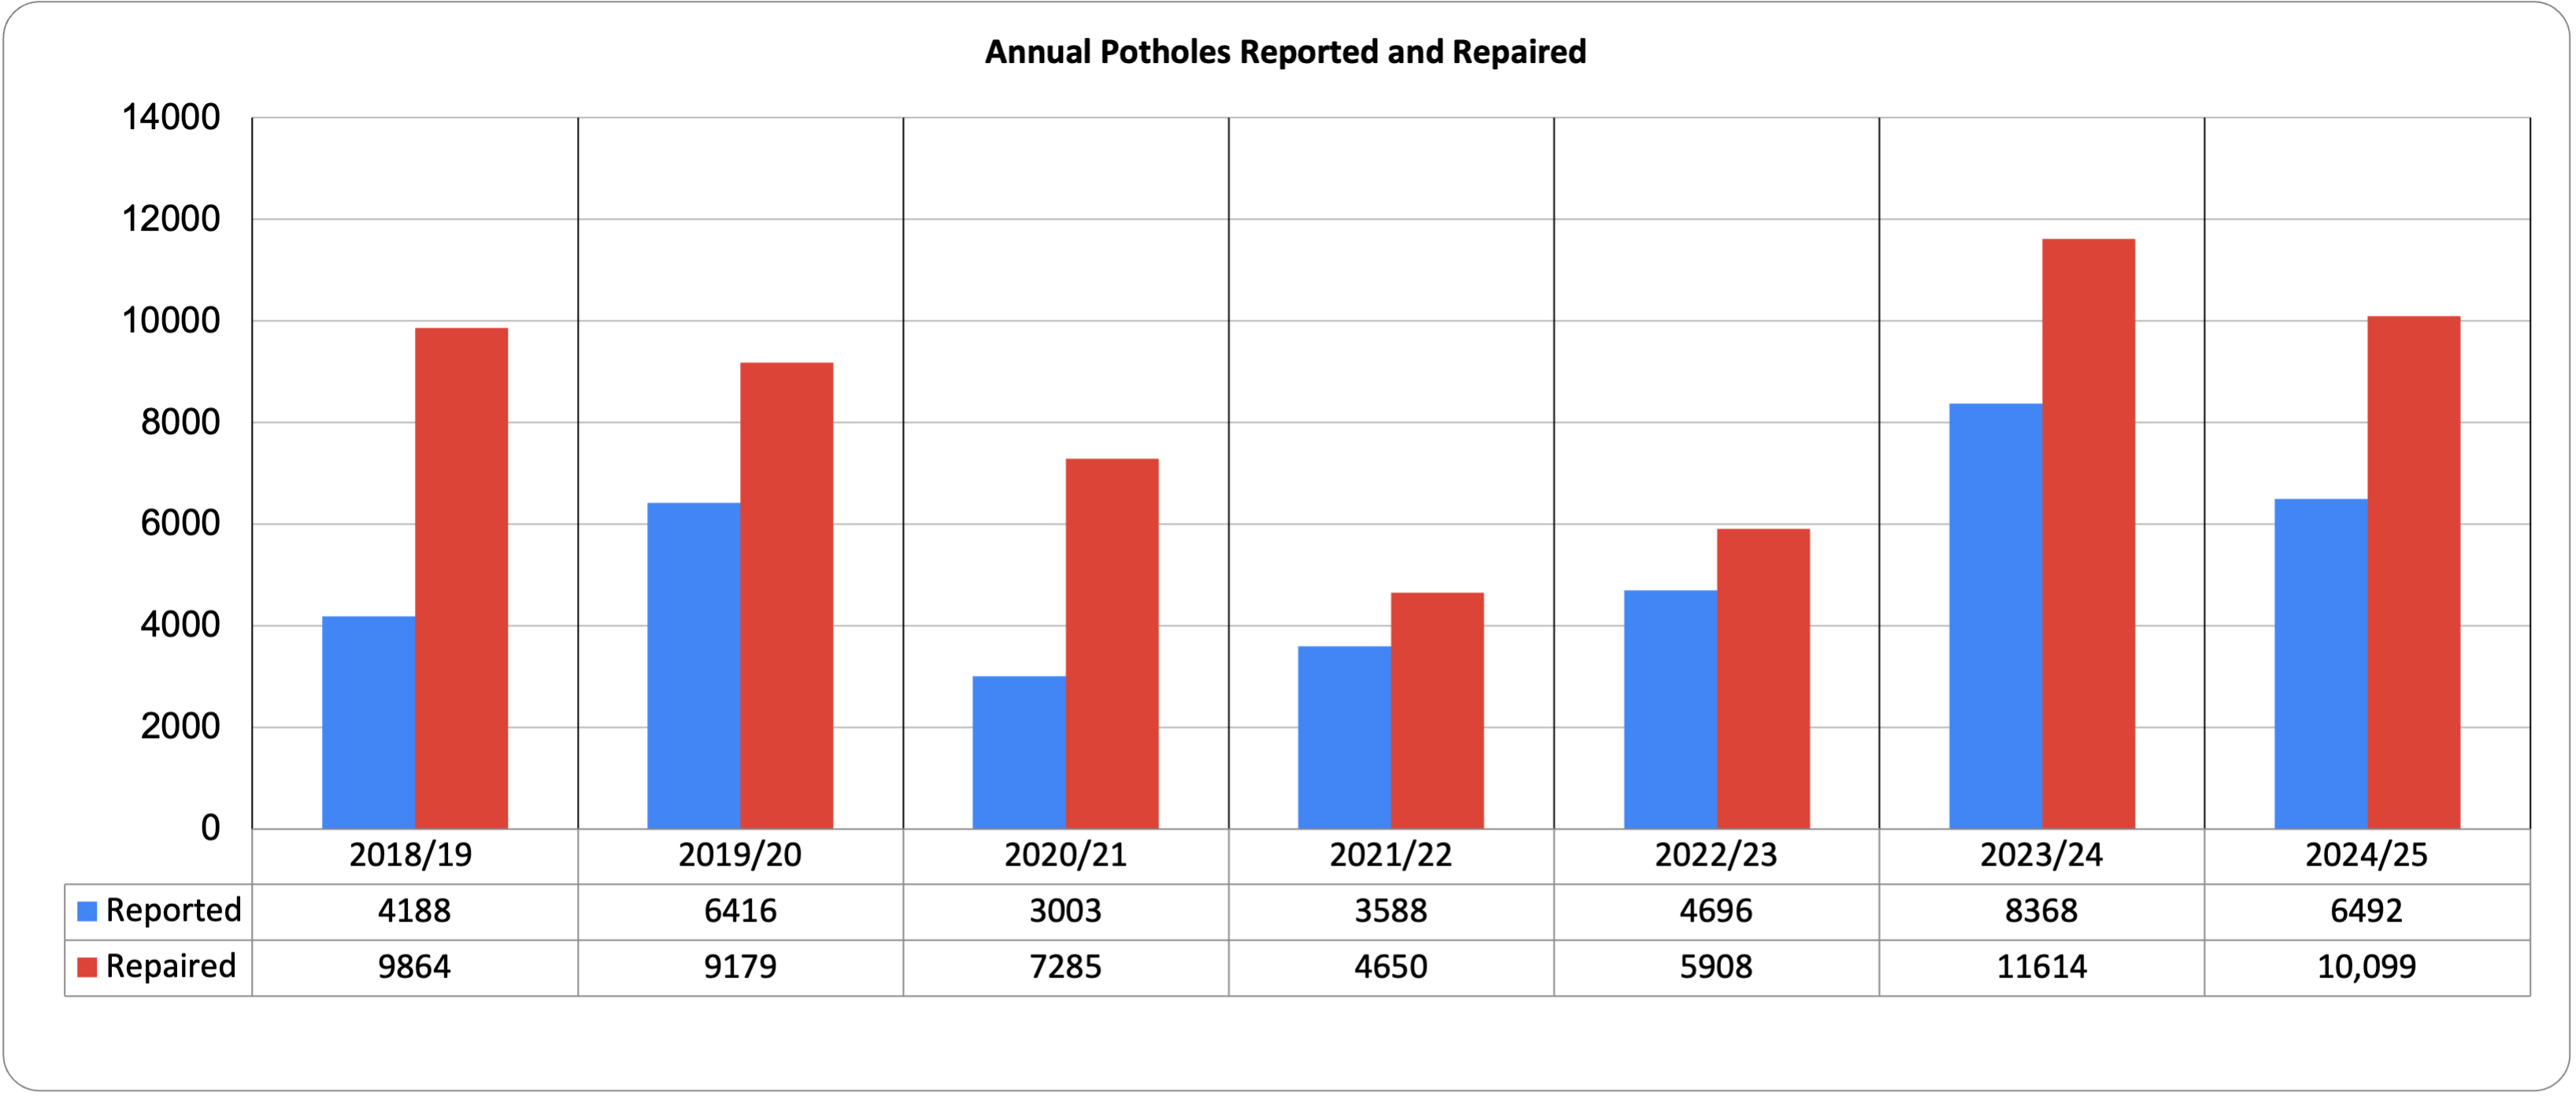
Annual potholes reported/repaired
This data shows the total potholes reported to us by members of public and number of potholes repaired by our contractors. The potholes repaired are either temporay fills, to make safe a defect quickly, or permenent first time fix repairs. Temporary repairs will be picked up for permanent repairs at a later date.
We have a team of dedicated find and fix gangs who are provided with a digital map of our C and D roads (County wide), they drive each road, find and fix any potholes along said road. Once the entire road has been driven the section is marked as completed.
The purpose of this exercise is to proactively identify and repair defects in their early stages of development before they require more invasive intervention and thus reduces future disruption to the network. It reduces the number of potential highway insurance claims, reduces future reactive maintenance costs and improves driver experience.
| Reported | Repaired | |
|---|---|---|
| 2018/19 | 4188 | 9864 |
| 2019/20 | 6416 | 9179 |
| 2020/21 | 3003 | 7285 |
| 2021/22 | 2560 | 4650 |
| 2022/23 | 3477 | 5908 |
| 2023/24 | 7240 | 11,614 |
| 2024/25 | 6492 | 10,999 |
Drainage – number of gullies inspected and cleaned per year
Warwickshire maintains over 114,000 gullies across the County. All gullies are emptied at least every three years, however County Highways have established a regime of variable frequency gully cleansing, adopted from 2021/22 financial year.
The procedure has been established to identify high risk sites and problematic drainage systems that require cleansing on a more regular basis (3 and 6 monthly intervals). Some gullies may not be cleansed on target as they are not accesible due to parked cars or other access issues. These gullies will be picked up outside of the standard routine cycle.
| Gullies inspected and cleaned | Cleans per annum | Target | Percentage |
|---|---|---|---|
| 2022/23 | 74,554 | 73,448 | 96.11% |
| 2023/24 | 77,575 | 77,439 | 94.85% |
| 2024/25 | 76,088 | 77,400 | 98.30% |
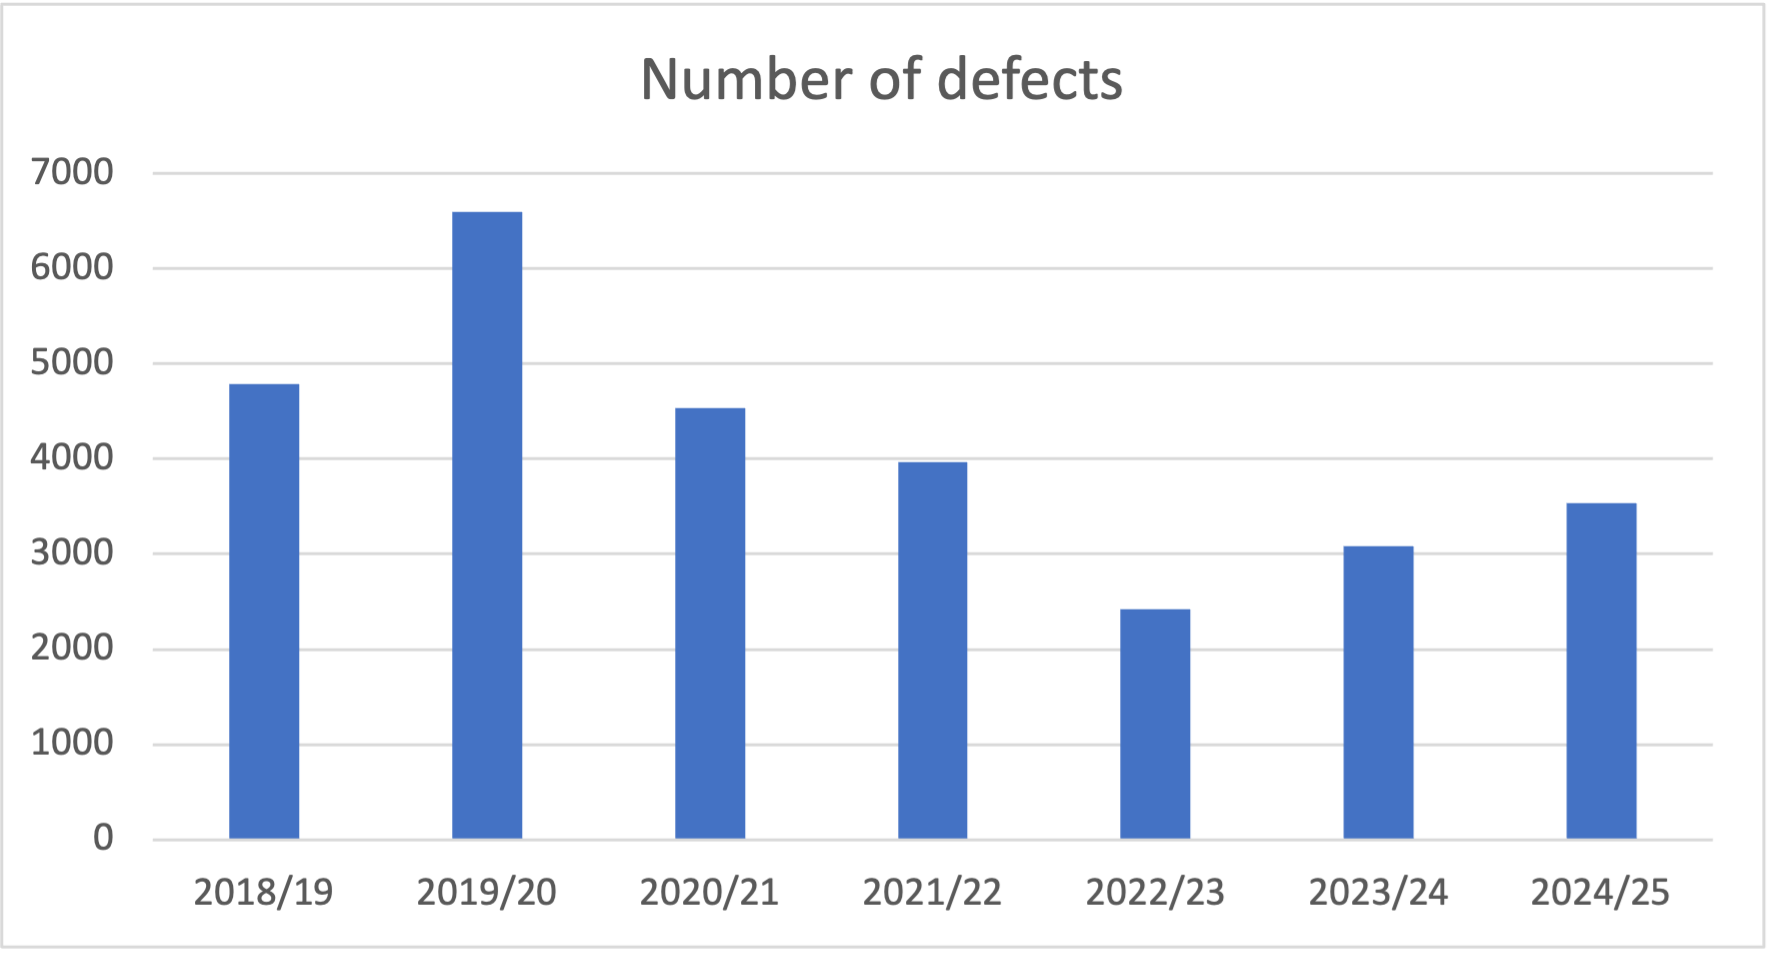
Street lighting – number of faulty lights reported to our contractors each year
| 2018/19 | 2019/20 | 2020/21 | 2021/22 | 2022/23 | 2023/24 | 2024/25 | |
|---|---|---|---|---|---|---|---|
| Number of defects | 4784 | 6598 | 4534 | 3966 | 2418 | 3081 | 3540 |
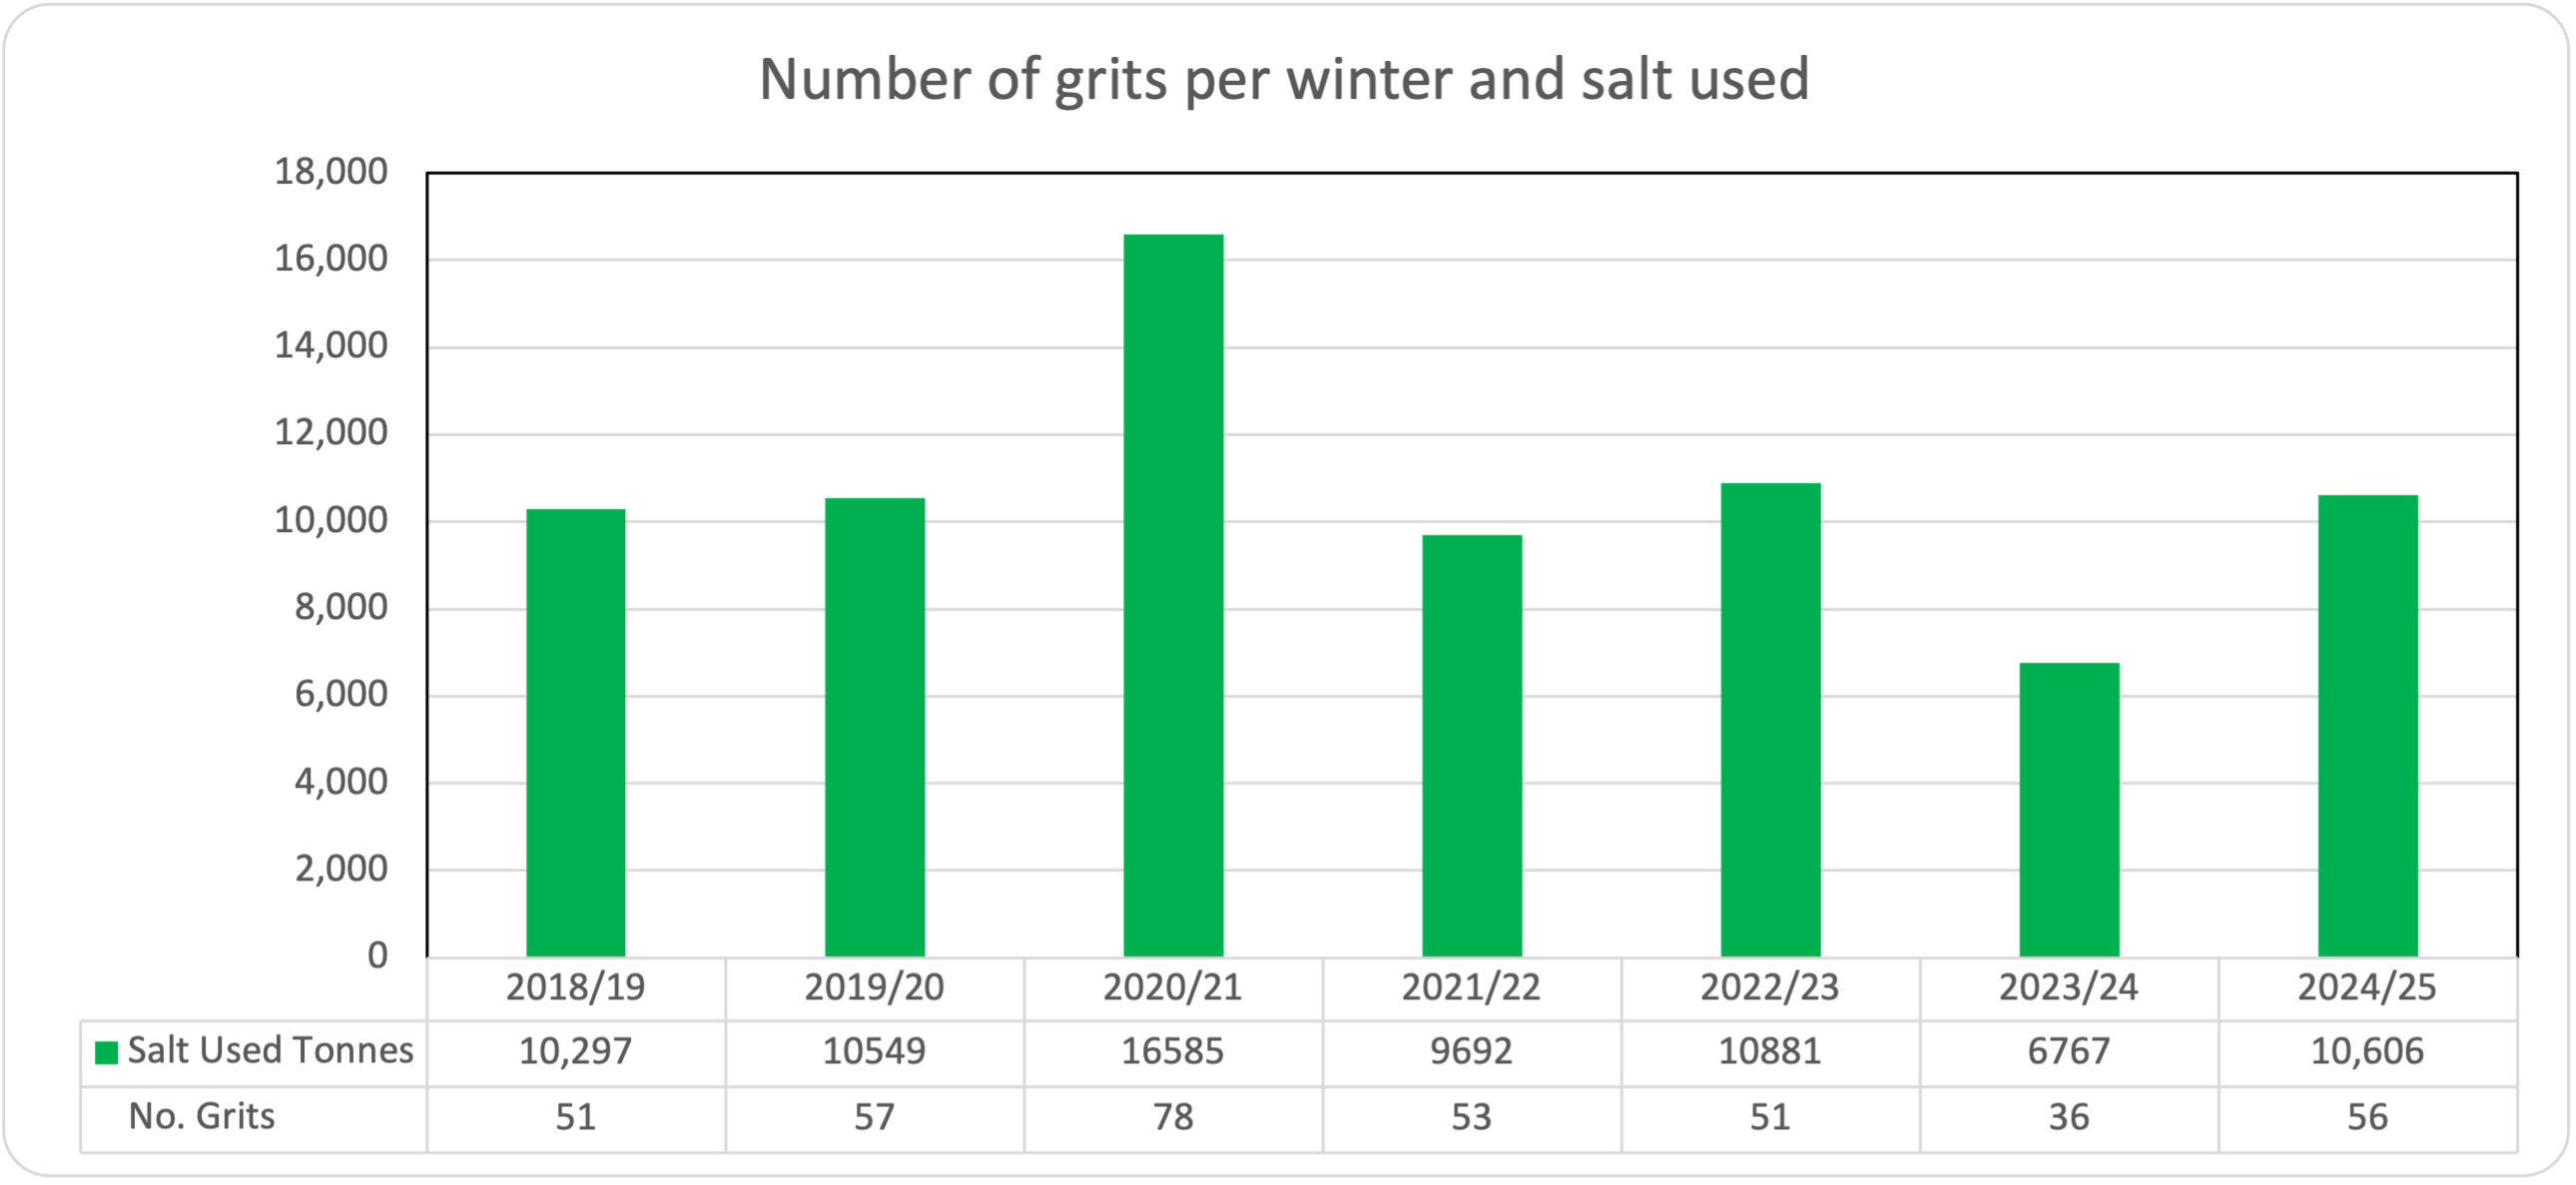
Winter maintenance
We treat approximately 46%, 1,100 miles, of our network when we grit. We have a policy which states that when the formation of ice is predicted we will treat:
- all main traffic routes, A roads, most B roads and one or two other strategic routes
- in urban areas, the access to hospitals and main industrial estates
- a single route into villages
The details in the chart show the distance we travel and the amount of salt used each winter.
View more information on gritting
| Winter | Number of grits | Total miles | Times around UK coastline | Salt used - tonnes |
|---|---|---|---|---|
| 2018/19 | 51 | 57,209 | 7.36 | 10,297 |
| 2019/20 | 57 | 64,172 | 8.26 | 10,549 |
| 2020/21 | 78 | 87,692 | 11.29 | 16,585 |
| 2021/22 | 53 | 61,514 | 7.92 | 9692 |
| 2022/23 | 51 | 59,075 | 7.6 | 10,881 |
| 2023/24 | 36 | 41,721 | 5.37 | 6767 |
| 2024/25 | 56 | 1,153.68 | 8.32 | 10,606 |