We are committed to maintaining our high levels of performance across the service.
We provide comprehensive performance data to managers across the service and to external stakeholders. On a regular basis, middle and senior managers review a performance tracker and address any areas of underperformance.
Our targets and measures
|
WFRS Performance Measures 2024-25 |
||||
|---|---|---|---|---|
|
Measure |
2021/22 Actual |
2022/23 Actual |
2023/24 Actual |
2024/25 Target |
|
If applicable |
||||
|
% times a first appliance arrives at life risk or property incidents within agreed response standards |
67.93 |
64.27 |
67.17 |
75 |
|
No. of Safe & Wells delivered to high risk vulnerable people |
No data - first record of 'HIGH PRIORITY' tag was in May 2022 |
1,116 |
1,586 |
1500 |
|
No. Fire Safety Order inspections carried out in higher risk premises |
86 |
183 |
402 |
600 |
|
No. of Road Traffic Collisions attended by WFRS |
373 |
384 |
440 |
No target appropriate |
|
No. of fire related deaths |
4 |
4 |
3 |
No target appropriate |
|
No. of fire related injuries |
27 |
29 |
34 |
No target appropriate |
|
NEW % 24hr On-Call appliance availability at all stations |
53.76 |
46.96 |
42.37 |
100 |
|
% Wholetime appliance availability |
96.12 |
98.39 |
99.13 |
100 |
|
No. of Incidents Attended by Warwickshire Fire and Rescue Service |
3,644 |
4,540 |
4,399 |
No target appropriate |
|
No. of Road Traffic Collision extrications undertaken by Warwickshire Fire and Rescue Services |
80 |
101 |
82 |
No target appropriate |
|
No. of Hospital to Home collections |
1,428 |
1,352 |
1508 |
No target appropriate |
|
No. of premises influenced by Fire Protection |
1,617 |
1,847 |
1977 |
1,800 |
|
No. of Fire Safety Orders inspections conducted |
116 |
265 |
557 |
460 |
|
NEW MEASURE % competency level for full time and on call firefighters in 9 core skill sets |
92.33 |
93.17 |
92.38 |
90% |
Incident data
The summary below illustrates incident levels attended over the last five years.
Total incidents attended
The summary below illustrates incident levels attended over the last five years.
The total number of incidents that we attended last year was 4398, which is less than the previous year. The reduction in attended incidents is due to the comparison to 2022 where we experienced a high volume of incidents due to weather related conditions (e.g. Heatwave and flooding).
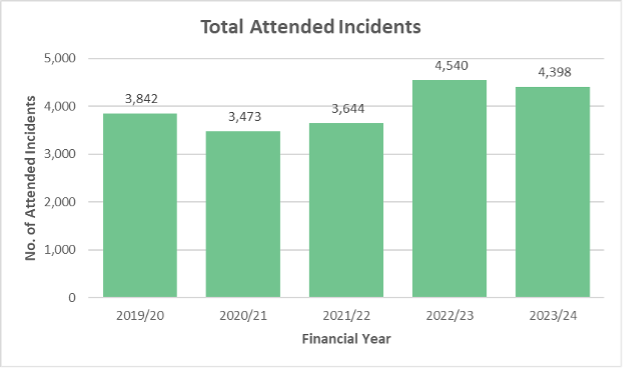
The incident level for previous years are as follows:
- 2019/20 - 3,842 total attended incidents
- 2020/21 - 3,473 total attended incidents
- 2021/22 - 3644 total attended incidents
- 2022/23 - 4,540 total attended incidents
- 2023/24 - 4,398 total attended incidents
Benchmarking
The Government collects data on all fire services and then provides comparison tables of data. We use this information to benchmark performance against key measures.
We are currently preparing our 2023/24 Performance Benchmarking Report, which compares our performance to the other 44 English FRSs.
View the benchmarking operational performance 2022/23 (PDF, 347 KB)